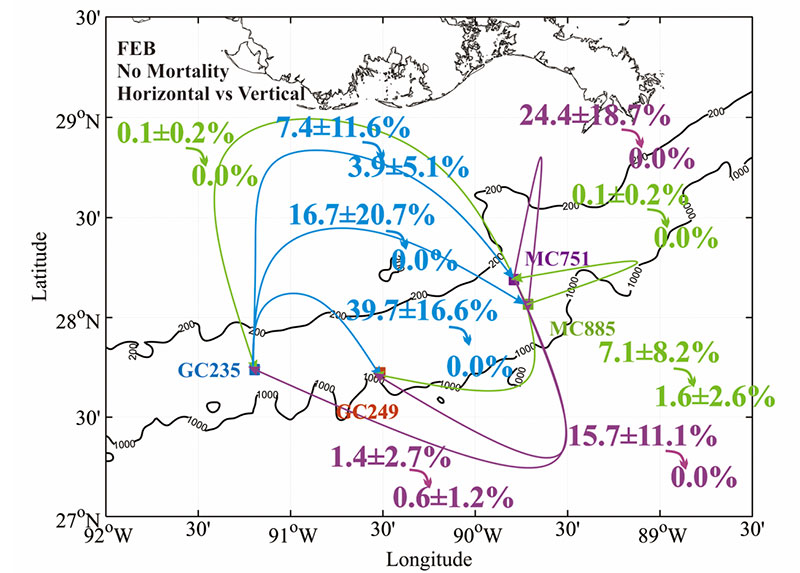
An example map showing the probability that larvae disperse from one area to another. This example depicts the potential that six releases of 4,500 passive particles (to simulate larvae) at four sites. The releases are on Days 1, 6 and 11 in each month in 2015 and 2016. The virtual larvae are followed for 30 days assuming no mortality and some capability of swimming/moving in the vertical direction. The color of the arrows corresponds to the site where the particles originated.
Larvae Dispersal Map
Image courtesy of Guangpeng Liu, modified from Bracco et al. 2019 (in revision). Download larger version (jpg, 613 KB).

An example map showing the probability that larvae disperse from one area to another. This example depicts the potential that six releases of 4,500 passive particles (to simulate larvae) at four sites. The releases are on Days 1, 6 and 11 in each month in 2015 and 2016. The virtual larvae are followed for 30 days assuming no mortality and some capability of swimming/moving in the vertical direction. The color of the arrows corresponds to the site where the particles originated.

Learn more