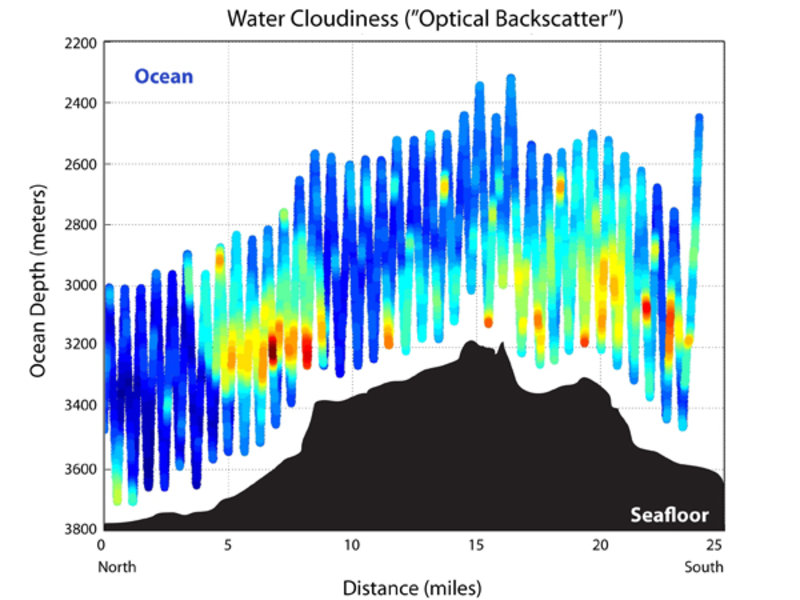
This graph shows the optical backscatter data from the second tow-yo above a spreading center. Reds and oranges show where the water was cloudier, while blues indicate mostly clear water. A hydrothermal plume could increase the amount of particular matter at these depths, making the water cloudy, but so could many other things...like earthquakes, perhaps?
Backscatter Data
Image courtesy of Dana Yoerger, modified by Benjamin Grupe. Download image (jpg, 97 KB).

This graph shows the optical backscatter data from the second tow-yo above a spreading center. Reds and oranges show where the water was cloudier, while blues indicate mostly clear water. A hydrothermal plume could increase the amount of particular matter at these depths, making the water cloudy, but so could many other things...like earthquakes, perhaps?

Learn more