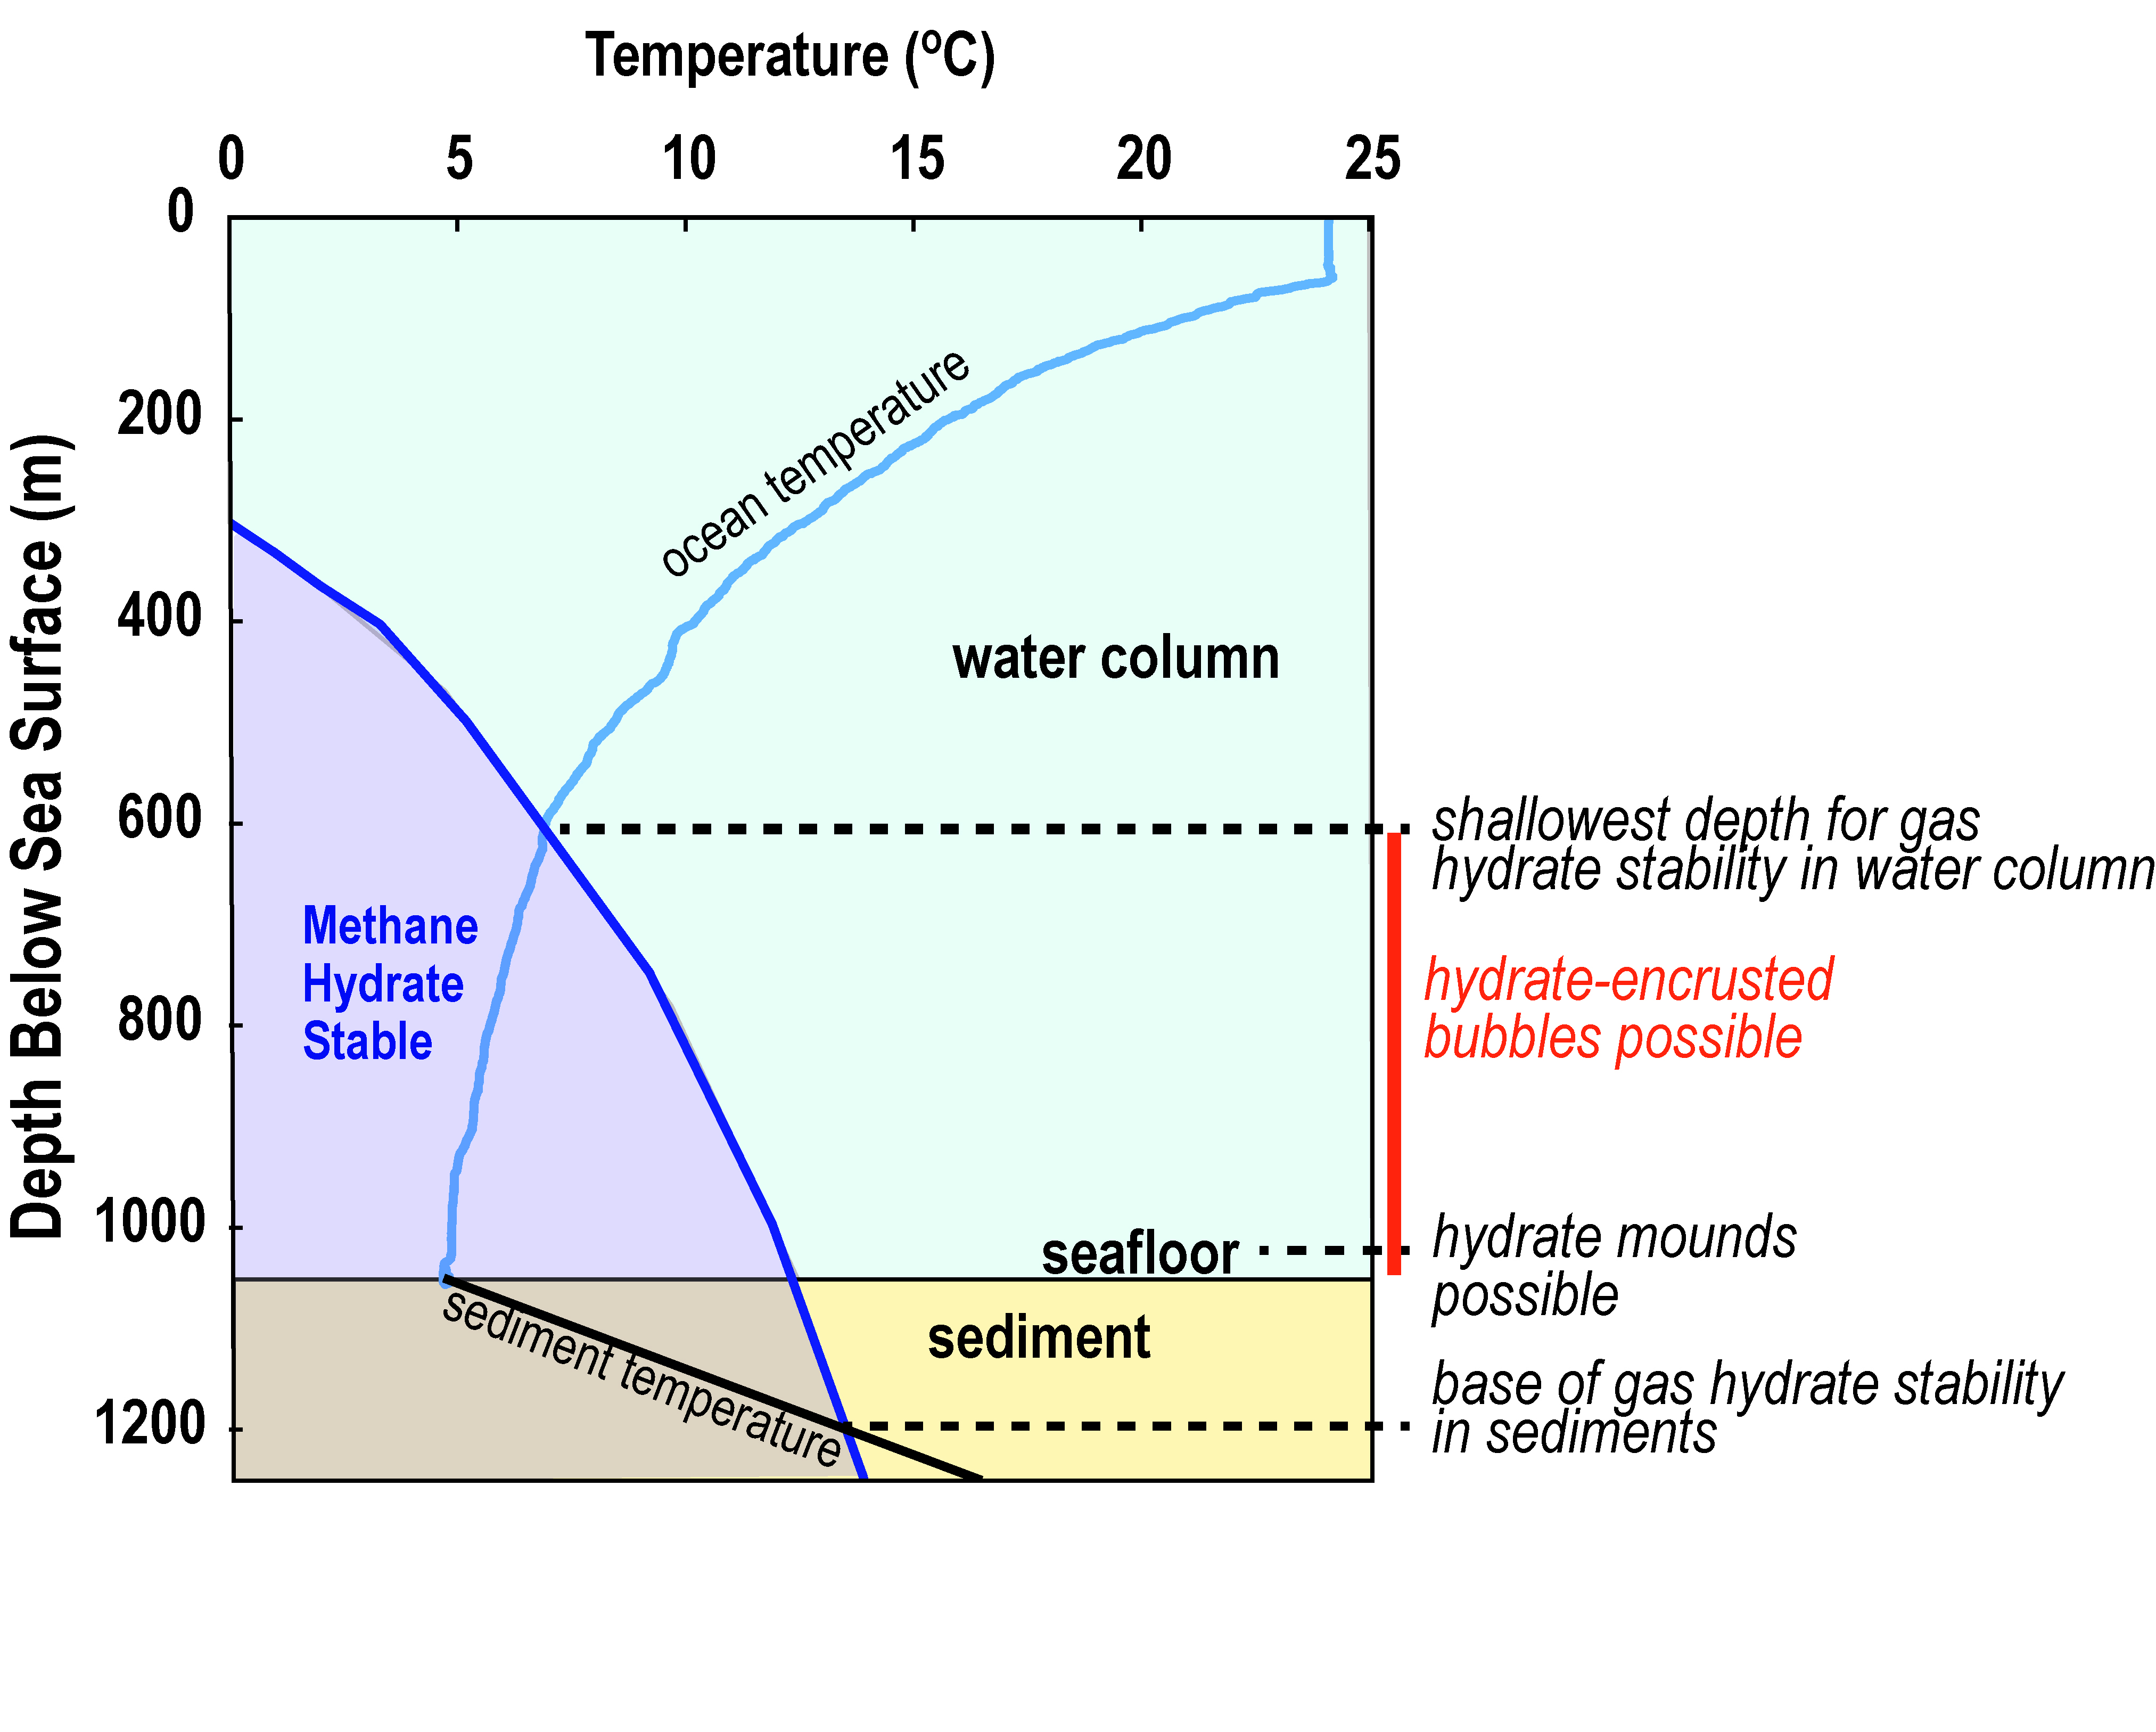
Methane hydrate is stable to the left of the purple curve on this temperature-depth plot. Each 100-meter (~328-foot) increase in water depth corresponds to a pressure increase of ~10 megapascals (~98 atmospheres). The blue curve shows the ocean temperatures measured by the conductivity-temperature-depth (CTD) sensor on the
Deep Discoverer ROV during Dive 17 at Horn Dome. The sediment temperatures are estimated based on a study that examined nearby well data. Gas hydrate is stable at the seafloor, in the shallow sediments, and from the seafloor to ~600 meters depth in the water column. Such conditions are typical for the deep ocean, but the Gulf of Mexico leaks such large volumes of gas that near-seafloor gas hydrate is more common there than in most locations.
Download larger version (jpg, 1.9 MB). increase in water depth corresponds to a pressure increase of ~10 megapascals (~98 atmospheres). The blue curve shows the ocean temperatures measured by the conductivity-temperature-depth (CTD) sensor on the Deep Discoverer ROV during Dive 17 at Horn Dome. The sediment temperatures are estimated based on a study that examined nearby well data. Gas hydrate is stable at the seafloor, in the shallow sediments, and from the seafloor to ~600 meters depth in the water column. Such conditions are typical for the deep ocean, but the Gulf of Mexico leaks such large volumes of gas that near-seafloor gas hydrate is more common there than in most locations.")