
By Lindsay McKenna Gray, Mapping Team Lead
Dan Freitas, Mapping Watch Lead
Charlie Wilkins, Senior Survey Technician
August 12, 2016
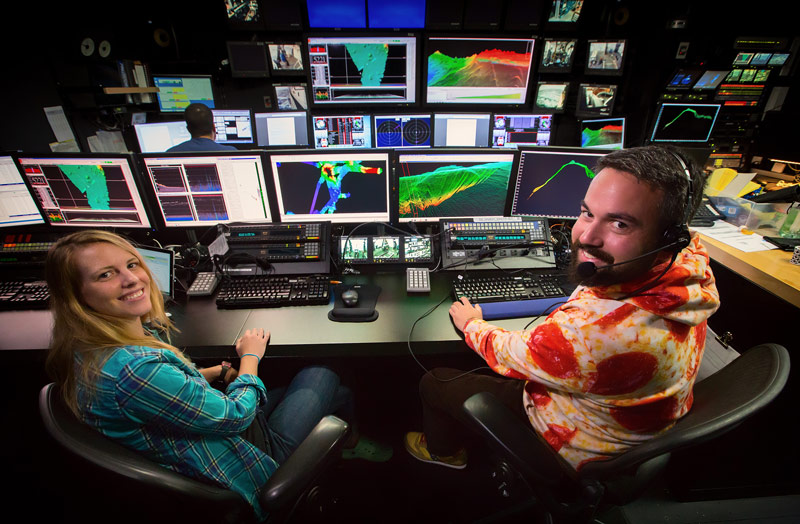
Mapping Team Lead, Lindsay McKenna Gray, and Senior Survey Tech, Charlie Wilkins, working in the control room. Image courtesy of the NOAA Office of Ocean Exploration and Research, Deepwater Wonders of Wake. Download larger version (jpg, 3.2 MB).
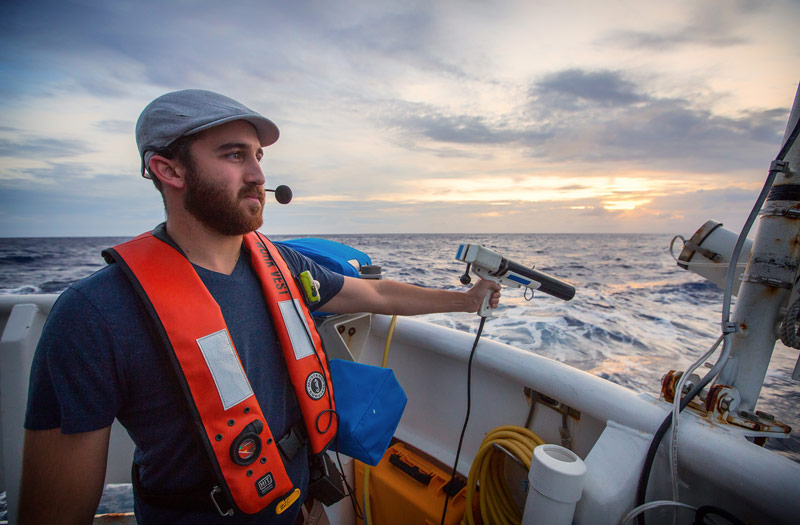
Mapping Watch Lead, Dan Freitas, conducting an XBT cast. Image courtesy of the NOAA Office of Ocean Exploration and Research, Deepwater Wonders of Wake. Download larger version (jpg, 3.3 MB).
When remotely operated vehicle (ROV) operations are completed for the day, the ship’s exploration priority switches to collecting seafloor bathymetry and water-column data. Right around dinner time, the lead scientists and video team vacate the back row of the control room, and the mapping team steps in to begin an evening of work.
The EM302 is used to collect seafloor bathymetry, seafloor backscatter, and water column backscatter. Backscatter represents the strength of the acoustic signal reflected from some target, whether that’s the seafloor or bubbles in the water column. The EM302 has separate transmit and receive transducers mounted on the hull of the ship. The sonar produces a swath of sound that can generate up to 864 soundings per ping. Computers are used to convert these signals into three-dimensional point clouds of individual bathymetric soundings of the seafloor. Watch-standers use sophisticated software to grid the point clouds, providing high-resolution visualizations of the seafloor.
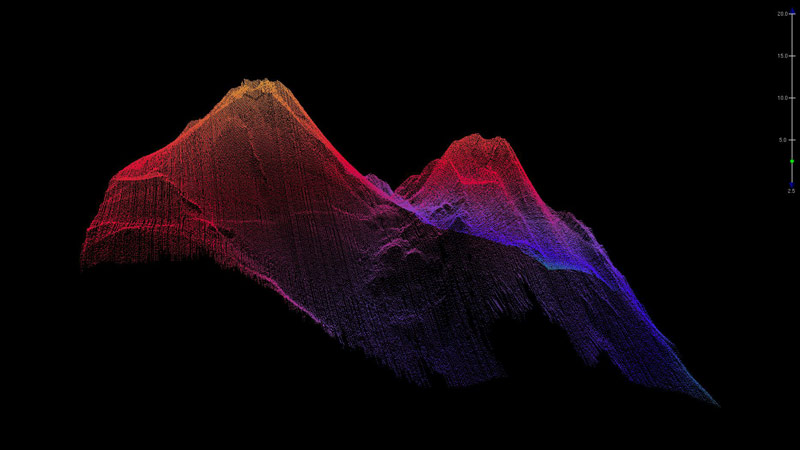
A point cloud of multibeam sonar soundings. Image courtesy of the NOAA Office of Ocean Exploration and Research, Deepwater Wonders of Wake. Download larger version (jpg, 1 MB).
The Knudson Sub-Bottom Chirp profiler collects shallow seismic reflection profiles, like the one below. This is useful for mapping sediments and deposits below the seafloor.
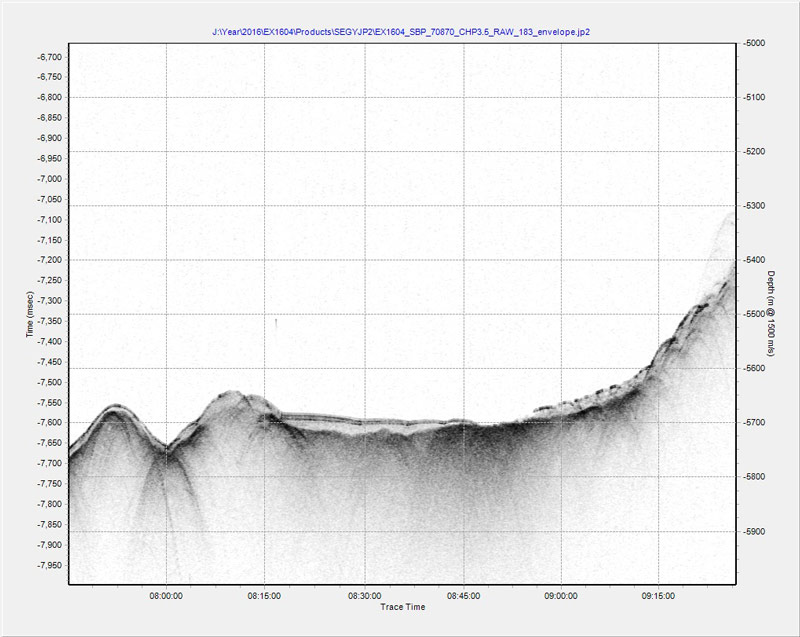
Sub-bottom seismic reflection profile at the base of seamount. Notice the lighter reflected sediment deposited over the darker underlying bedrock. Image courtesy of the NOAA Office of Ocean Exploration and Research, Deepwater Wonders of Wake. Download larger version (jpg, 415 KB).
The four Simrad EK-60 sonars onboard provide calibrated water-column backscatter. The calibrated backscatter can be used in bubble detection and to map biomass in the water-column. In the depths that the Okeanos Explorer typically works, the 18kHz EK60 sonar is the only sonar that can provide single-point reflection seafloor. The other sonars use a higher frequency and the acoustic signal is attenuated before reaching the deep ocean seafloor.
If you take a look at the Pacific Ocean in Google Earth, you can see many seafloor features such as mid-ocean ridges and deep trenches. Most of these features are derived from gravity measurements made with satellites that orbit Earth. These satellite-derived bathymetry maps provide a very good low-resolution map of the seafloor. However, if you zoom in on a particular feature, it gets very fuzzy; this is because the satellite-derived bathymetry cannot be used resolve features smaller than about one kilometer.
Multibeam sonars can achieve 10 times the resolution of satellite-derived bathymetry. If you are familiar with multibeam mapping operations, you might have heard the term “mow the lawn” before. When we set out to map an area of the seafloor, we do not do so randomly, we drive the ship in a systematic pattern over the feature, and this pattern often mimics how you would mow your lawn. The image below shows the actual lines that the ship drove on the Mapping in the Pacific Remote Islands Marine National Monument expedition to map portions of the McDonnell Seamount; the average line spacing between lines is 4,000 meters.
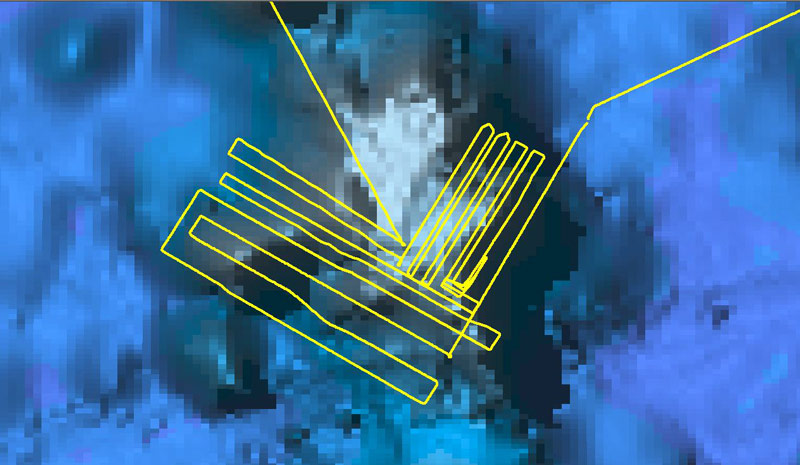
Lines transited over McDonnell Seamount during the Mapping in the Pacific Remote Islands Marine National Monument expedition. Image courtesy of the NOAA Office of Ocean Exploration and Research, Deepwater Wonders of Wake. Download larger version (jpg, 548 KB).
On the Okeanos Explorer, our field season is made up of three types of cruises. We start the season off with "shakedown" cruises, where our main objective is to test all the ship’s systems and scientific equipment after it’s been sitting idle in dock for a while. We also have mapping-only cruises, where we conduct 24/7 mapping operations. Often times a mapping cruise will precede an ROV cruise so that we have mapping data to help plan dives. And of course, we have combined ROV and mapping cruises, such as our current cruise. Much of the mapping data we’re using on the Deepwater Wonders of Wake expedition was collected during the Mapping in the Pacific Remote Islands Marine National Monument expedition, a mapping cruise. The images below show the progression of mapping data over the McDonnell Seamount, which is one of the largest seamounts in the monument.
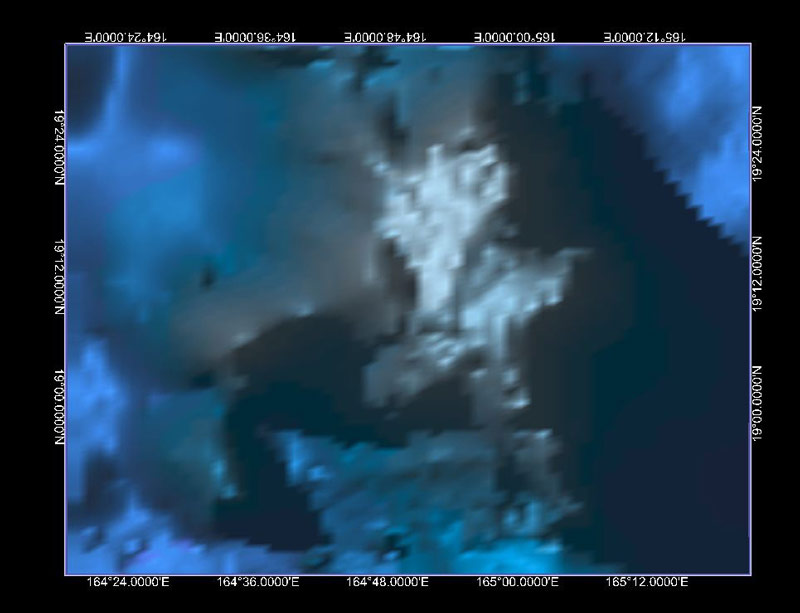
Before the Okeanos Explorer collects mapping data in an area, all we know about the area is what we can see in the satellite-derived bathymetry. Image courtesy of the NOAA Office of Ocean Exploration and Research, Deepwater Wonders of Wake. Download larger version (jpg, 245 KB).
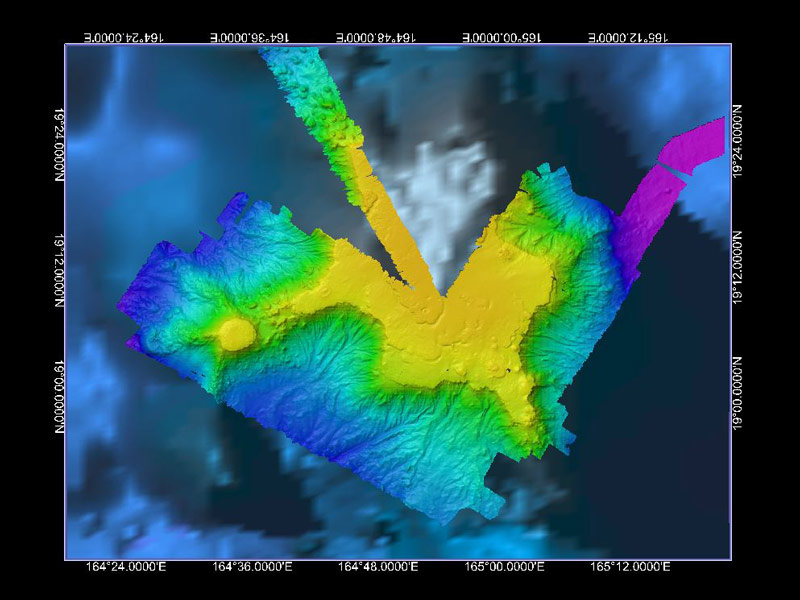
The multibeam bathymetry collected during during the mapping in the Pacific Remote Islands Marine National Monument expedition gridded to 75 meters. There was not enough time on that cruise to collect data over the entire seamount, which measures roughly 3,600 square kilometers. Image courtesy of the NOAA Office of Ocean Exploration and Research, Deepwater Wonders of Wake. Download larger version (jpg, 357 KB).
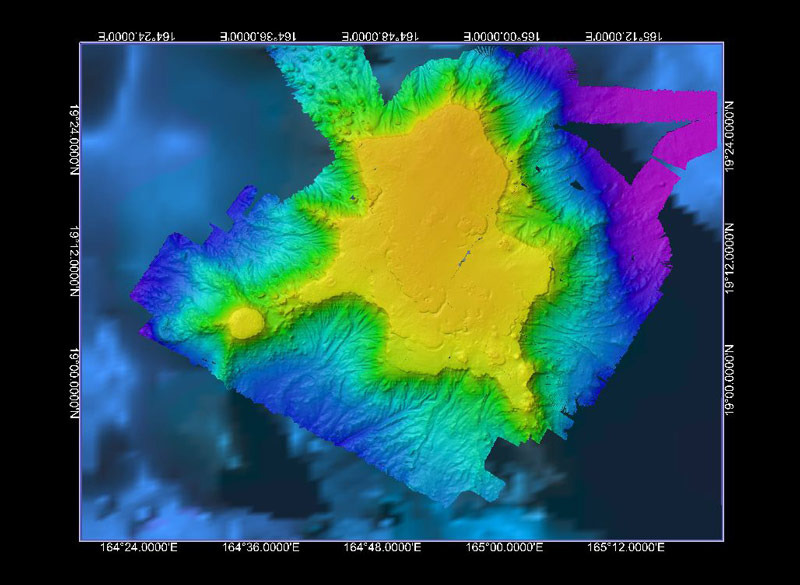
On the current Deepwater Wonders of Wake expedition, we had a few weather days where we couldn’t deploy the ROVs, this allowed us time to map over McDonnell Seamount, completing coverage over the seamount. Image courtesy of the NOAA Office of Ocean Exploration and Research, Deepwater Wonders of Wake. Download larger version (jpg, 389 KB).