

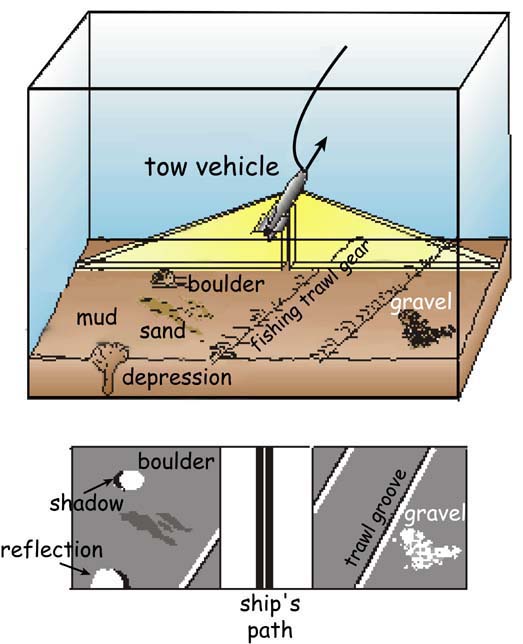
Schematic diagram of a sidescan sonar towed instrument insonifying the seafloor (top) and the sidescan data record created (bottom). The intensity of sound reflected back from rocks, sediment and other features provides information on the distribution and characteristics of the seafloor morphology. Strong reflections (high backscatter) from boulders, gravel and positive topographic features facing the instrument are white and weak reflections (low backscatter) from finer sediments and shadows are in black. Image courtesy of Lewis and Clark 2001, NOAA/OER.
Reference: US Geological Survey Seafloor Mapping Technology Web site
The figure and caption were modified