
By Alanna Durkin, Temple University, PhD Student
September 21, 2017
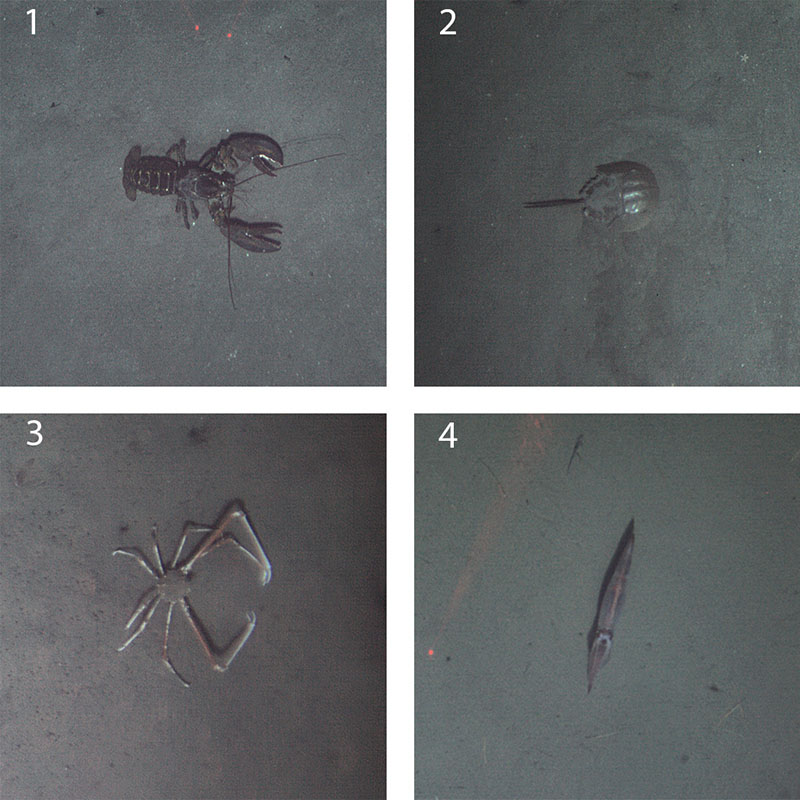
These are a few of the organisms that we’ve found most often in our Sentry photos: (1) lobster, (2) horseshoe crab, (3) spider crab, (4) squid. Image courtesy of AUV Sentry, DEEP SEARCH 2017, NOAA-OER/BOEM/USGS. Download larger version (jpg, 843 KB).
Several previous DEEP SEARCH mission logs have bragged about the tens of thousands of seafloor photos that autonomous underwater vehicle (AUV) Sentry has taken so far despite the weather limiting our dives. These photos, and other data collected by Sentry, are a significant increase in our knowledge of areas of the deep sea that have never been seen before by human eyes! They are also a somewhat daunting task to me—the pair of human eyes that needs to look at them all.
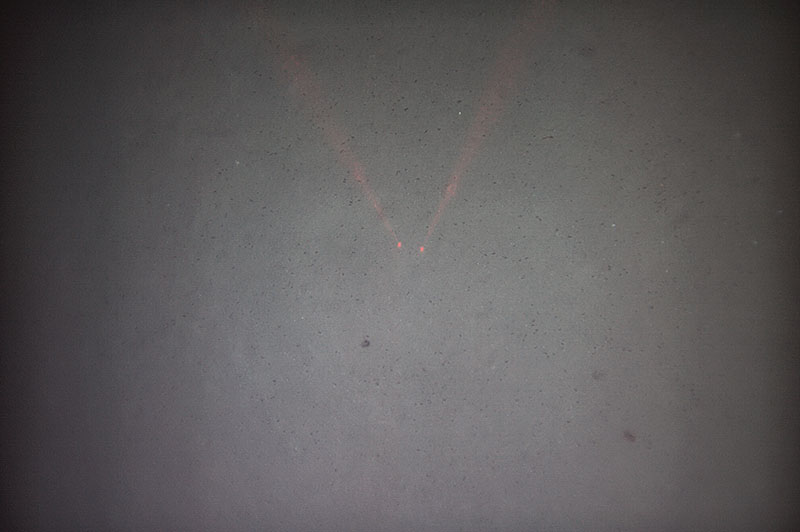
A photo from Dive 454 shows the most common deep-sea habitat: soft sediment. Image courtesy of AUV Sentry, DEEP SEARCH 2017, NOAA-OER/BOEM/USGS. Download larger version (jpg, 4.4 MB).
To get through these mounds of photos, I wrote my own image annotation software that lets me rapidly flip through pictures while recording habitat and animal observations. The presence or absence of different features in the photos are then automatically paired with geographic location and the water chemistry data Sentry collected at the same time as it snapped the photo. Within a few hours, I can make maps from this comprehensive dataset to show where we find seeps and corals and what kind of environment these animals inhabit.
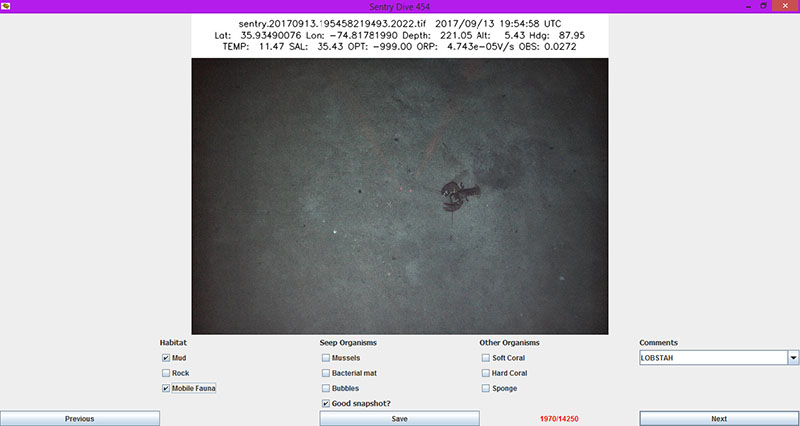
A screenshot of Alanna Durkin’s image notation software with an example photo from Dive 454 on Kitty Hawk. She is able to quickly record what kind of habitat she’s seeing and what sort of organisms are present. She can also add any additional comments on what she’s seeing and flag especially good snapshots for easy access. Image courtesy of DEEP SEARCH 2017, NOAA-OER/BOEM/USGS. Download larger version (jpg, 413 KB).
Since one of the main goals of the DEEP SEARCH cruise is to ground truth seeps at bubble plume targets, my program lists seep organisms (mussels and bacterial mats) among its predetermined checkbox categories. At Kitty Hawk and Pea Island, these photos confirmed the presence of chemosynthetic organisms at suspected seep sites for the first time! Pea Island in particular is home to large, widespread bacterial mats that rely on seepage for nutrition. So far no megafauna, such as clams and mussels, have been spotted, and microbes remain the only seep organisms inhabiting Kitty Hawk’s and Pea Island’s seeps.
Because these visual observations of bacterial mats are paired with Sentry’s water chemistry data, we can characterize how the environment changes between seep and non-seep habitat. One sensor in Sentry’s suite is designed to detect seep chemicals by measuring oxidation reduction potential (ORP). When the change in ORP over time is mapped out and overlaid with the locations of visible bacterial mats (white bars and dots), it’s clear that the microbes are clustering around areas of large gradients in ORP (shown in red).
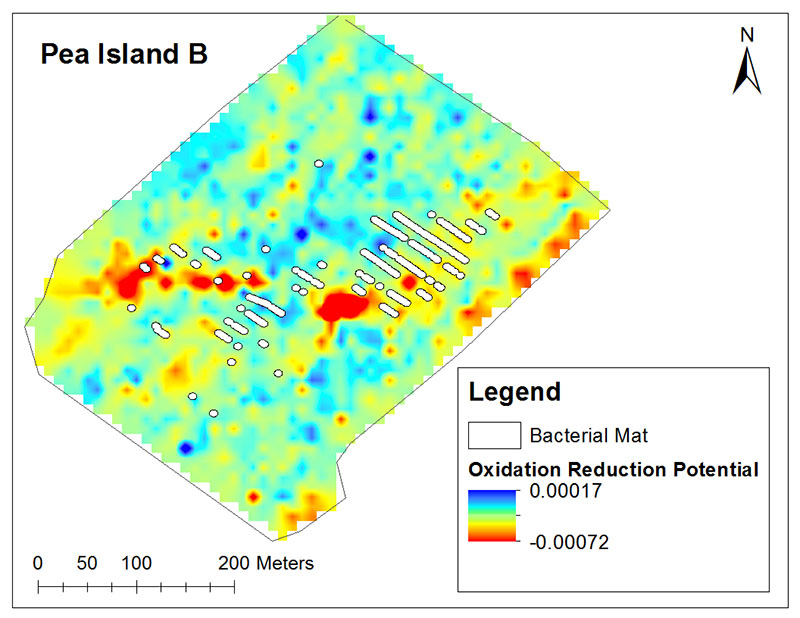
This map, created by Alanna Durkin in ArcGIS, shows interpolated change in oxidation reduction potential over time and the presence of bacterial mats at one of Pea Island B’s seeps. Image courtesy of DEEP SEARCH 2017, NOAA-OER/BOEM/USGS. Download larger version (jpg, 453 KB).
To keep my workflow flexible, I also have a way to add comments to my annotations to capture any notable, repeated features that are not included in my checkbox categories. In the photos from Kitty Hawk, the comments allowed me to track the locations of horseshoe crabs and lobsters and save those photos for later viewing.
One especially remarkable pattern that was visible at both Kitty Hawk and Pea Island was the large numbers of fish clustered around rocks. As is true with the deep sea in general, most of the seafloor habitat at these sites is wide, flat expanses of soft mud. At the few areas where hard substrate was present, however, the rocks were swarming with high densities of fish!
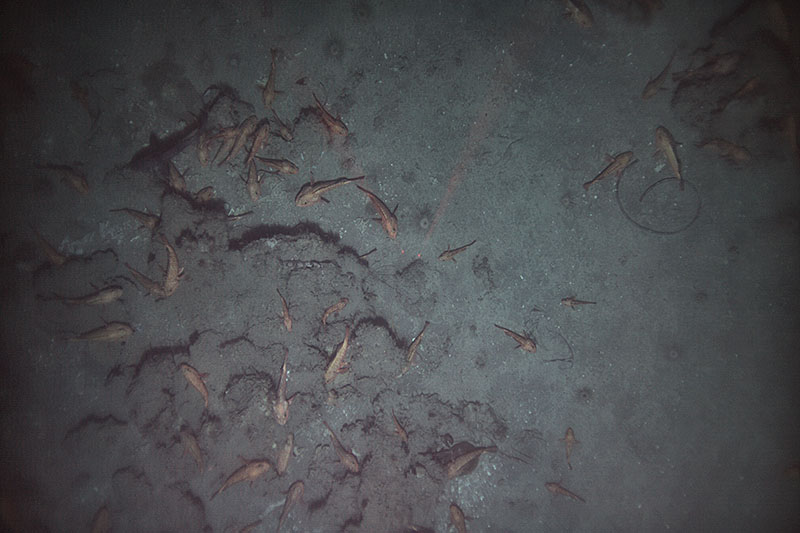
A photo from Dive 454 shows large numbers of fish associated with hard, rocky habitats. Image courtesy of AUV Sentry, DEEP SEARCH 2017, NOAA-OER/BOEM/USGS. Download larger version (jpg, 4.6 MB).
This grouped pattern of fish is another reminder of how essential it is to investigate and map deep-sea ecosystems at this fine scale. The vital habitats that DEEP SEARCH is studying have extremely patchy distributions across the seafloor, and it will take a lot more mapping and exploration to better understand their distribution and determine how different species respond to these localized features.