


Bathycache: The Truth Is in the Ground
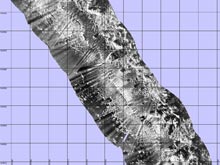
An example of a high-resolution side-scan sonar mosaic created from survey data collected by the GeoSwath sonar on the Gavia autonomous underwater vehicle (AUV). The image results from the measurement of high-frequency (500 kHz) short bursts of sound waves that bounce off of the seabed and return to the sonar unit. Bright areas indicate high return energy associated with coral fragments or scattered rocks, while dark patches represent shadow zones (areas where the sound was blocked) or patches of soft sand and/or mud that absorb more sound than rocks or corals. In this image the beach is towards the right and each grid cell is a 10- by 10-meter (m)/33- by 33-foot (ft) square. The total swath width (lateral distance from edge to edge) is 40 m (131 ft) , and the line length from tip to tip is approximately 100 m (328 ft). Click image for larger view and image credit.
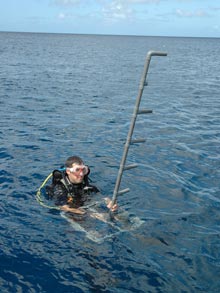
Despite appearances, Chris Coccaro is not trying to become an underwater plumber, rather he is getting quite a work out assisting Daniel Jones in conducting oxygen profiles within the bottom boundary layer above the reef. This “Christmas Tree” device consists of PVC pipes: the pipe is placed at a planned and measured elevation with narrow spacing towards the bottom and increased spacing moving upward following a logarithmic scale. Divers gently lay this device on the sea floor and use an oxygen sensor to gather a time-series of oxygen measurements at each elevation. Once the data is plotted, the scientists look for patterns of the oxygen concentrations over the reef, which provides an indicator of the health and productivity of the coral system. Click image for larger view and image credit.
January 17, 2008
Arthur Trembanis
Expedition Co-principal Investigator
Assistant Professor, University of Delaware
AUV Operations and Marine Geologist
In addition to the shape of the sea floor, the information we gather from the autonomous underwater vehicles (AUVs) tells us about the nature of the composition of the bottom, e.g. whether it is sandy or coral covered. To do this, we use a technology called side scan sonar resulting in images like those seen in this log entry. This shows the intensity of the sound that bounces off the sea floor and back to the robots.
Imagine what your living room would look like at night illuminated only by the light and shadow of a flashlight and you will begin to get a sense of what kinds of images side-scan sonar is providing. Light areas indicate hard acoustic returns, such as what you would expect from a large brain coral, while darker areas indicate shadow or zone with more subdued topography or possibly fine sand. Notice that I said, rather ambiguously, what might be causing the light and dark patches. The reason is that there are many combinations that can make similar patterns, and it is only through careful ground-truthing (i.e., taking close-up visual or physical samples) that scientists are able to differentiate one bottom type from another. The task of ground-truthing is strenuous, repetitive, and thankless work, but it is critical to the habitat mapping we are doing here in Bonaire. Many students came to our aid recently to help us conduct sonar ground-truthing here at the science compound by swimming out to document various acoustic targets on the sea floor and noting the kind of bottom-type and marine organisms associated with the feature(s).
We have managed to conduct sea-floor-mapping surveys in six separate locations, acquiring many tens of square kilometers of sea-floor mapping data, in addition to water column data regarding the conditions within the water (salinity, temperature, oxygen levels, etc).
AUV operations are not without their challenges, especially on windy islands such as Bonaire. Sometimes we have to call on various support equipment to help us locate the robots amidst the choppy surface waves. One such instrument we use is called an acoustic pinger. The operator wears a set of headphones, like you might use for listening to an MP3 player, while the other end is composed of a hydrophone, essentially a microphone for picking up underwater sounds. By changing the orientation of the hydrophone “bell” the operator can get a sense of the direction from which the sound is coming. The intensity, or loudness, of the sound is an indicator of the distance that the hydrophone is from the sound source. Each robot luckily has its very own distinctive sound pattern thus allowing us to tell each robot apart — even if they are many hundreds of meters away underwater.
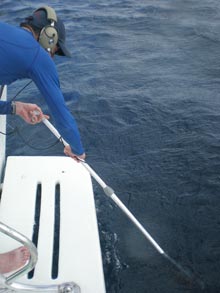
Bernard Laval demonstrating the use of the acoustic pinger. Click image for larger view and image credit.
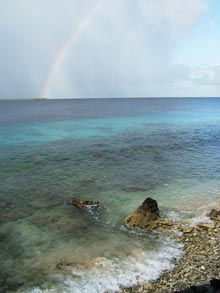
After a few showers, a brilliant rainbow emerges. Click image for larger view and image credit.
At the end of the day, though, the reward is to recover the robot and then enjoy a break in the clouds and showers to watch a brilliant rainbow emerge.
Sign up for the Ocean Explorer E-mail Update List.