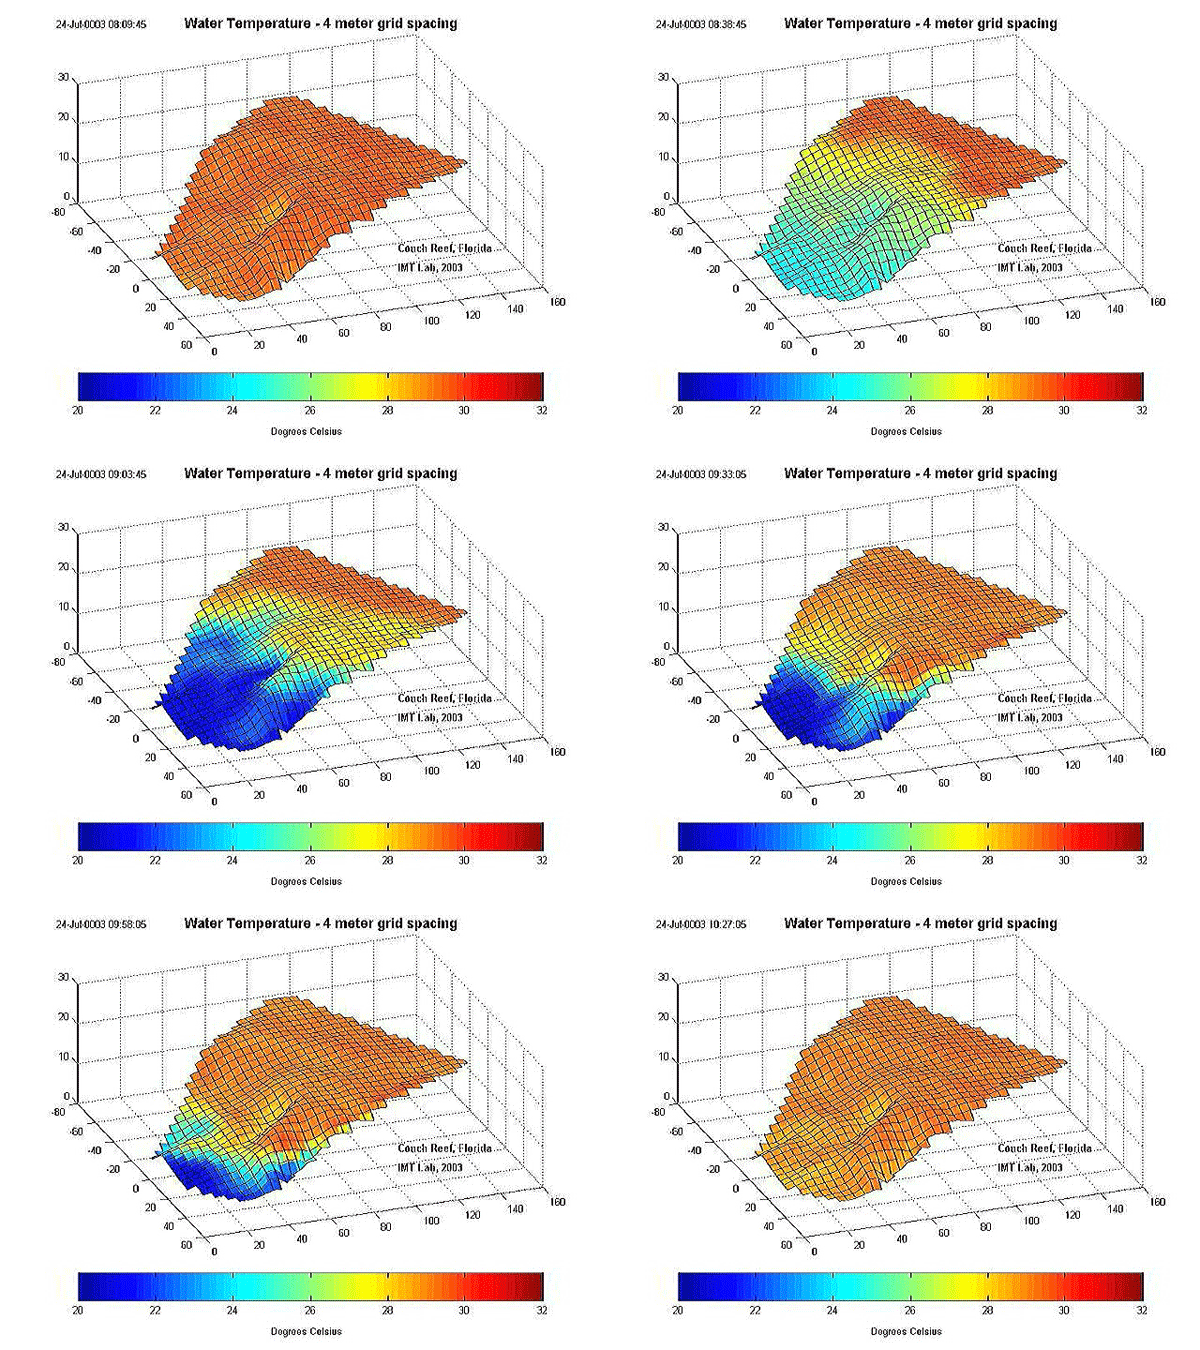
Figure 3. Animation of data acquired by the Scripps BOA array, a network of temperature sensors logged by a computer. This animation shows an internal wave traveling up the slope of a coral reef in Florida. This wave brings colder, nutrient rich water up onto the reef. Red colors indicate warmer water and blue is cold water, ranging from about 20º to 30º C (68º to 86º F). The vertical axis of the animation is depth and the horizontal axes reflect the area covered by BOA. This is a remarkable change in temperature recorded over a matter of hours and minutes on the reef. You can see that sometimes water moves up the spurs and grooves of the reef face, or gets caught in pockets. It will be interesting to see whether there are internal waves around Bonaire’s reefs. Animation courtesy of Bonaire 2008: Exploring Coral Reef Sustainability with New Technologies expedition.
Related Links
Bonaire 2008: Exploring Coral Reef Sustainability with New Technologies
Bonaire 2008: Exploring Coral Reef Sustainability with New Technologies: Oceanography


