

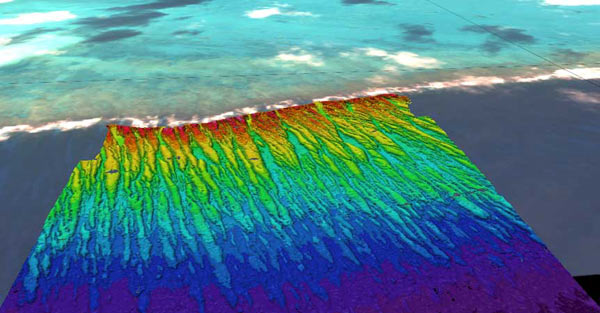
An example of a seafloor map made from multibeam echosounder data. The data illustrated here were collected by the NOAA Pacific Islands Fisheries Science Center at Kure Atoll in July 2006, and are overlain on satellite imagery of the atoll. The multibeam data are color-coded by depth (reds are shallow, blue colored areas are deeper) and clearly illustrate the spur-and-groove morphology often found in coral reef ecosystems. Image courtesy of NOAA, Pacific Island Fisheries Science Center.