

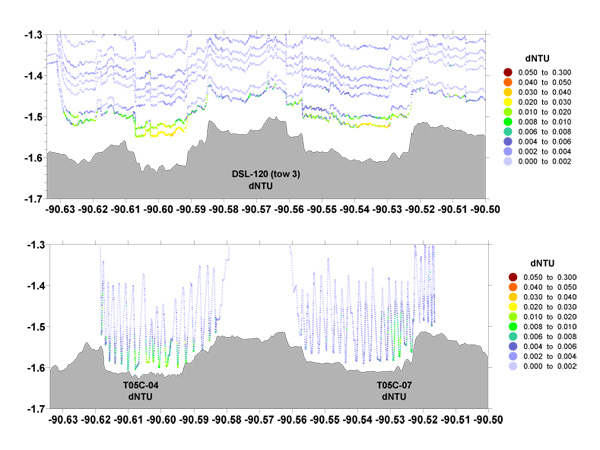
The graphs above show how MAPR data acquired during the DSL tows compares to CTD tows at the twin caldera location. The top graph shows the LSS data collected by MAPRs during the DSL120 tow, and the lower graph shows LSS data collected during CTD tows. Looking at both sets of data helps reveal the height and spread of vent plumes off the seafloor. Image courtesy of Sharon Walker.
Related Links
GalAPAGoS: Where Ridge Meets Hotspot
GalAPAGoS: Where Ridge Meets Hotspot - Jan 7 Log